![]()
![]()
![]()
Teachers Introduction Course to LEGO® Mindstorms NXT & EV3
(version 4.5)
UNIT 6. Inside a two-step simple line follower: data logging and “experiments”.
One of the most obvious and fundamental aspects about the relation between a robot’s software and hardware, which students do not always understand, has to do with both execution speeds and their relation. In this pedagogical unit we will use the datalogging tools available in the Mindstorms software to study the internal operation of a simple two-step line follower with one light or color sensor, which we have already programed before. It is a very simple example that can help to understand and to correctly program other situations.
Although it is possible to use the NXT or EV3 brick’s screen to display messages and sensor readings, in specific situations it is not possible to stop the robot to read its screen. In those cases, we need either to record the data to analyze it later, or display data in real time on the computer, if it is connected to the intelligent brick.
This pedagogical unit explains in detail the concept of datalogging by means of manually accessing files, the management of these files from the software using uploads and downloads, and their subsequent query and analysis. We will use data conversion, logic and data wires to control the program flow.
It also takes advantage of the datalogging feature within Mindstorms to automatically record data and visualize it graphically in the computer screen. This capacity to generate and relate the sensors’ readings different curves in function of time, called “experiment”, can be extremely useful in many and diverse situations. The LEGO Mindstorms NXT or EV3 software includes an interface devoted to data recording or data logging visualization that this unit explains in some detail, because it is very useful to deeply understand and better relate diverse concepts in a graphical manner.
Finally, it should be mentioned that the data record or “data logging” can be a very useful way of “debugging” a computer program, given that, in many occasions, it allows to understand much better the program flow and the reasons of its decision making process, like for example, how a switch works inside a loop.
A little bit of theory
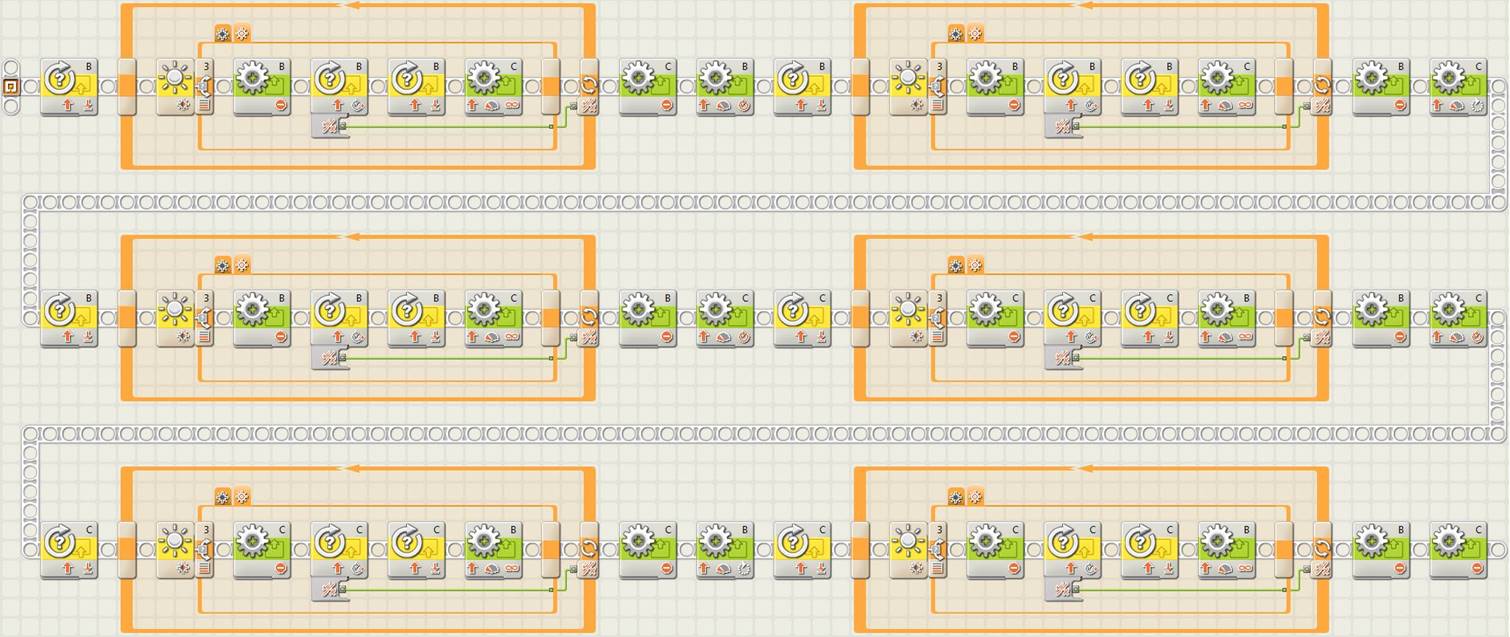
If we study with a little detail how unit 5 initial line follower works, shown in the image below, we can ask ourselves how many times the program passes through each one of the switch options before changing the option, meanwhile the time loop of our example lasts.
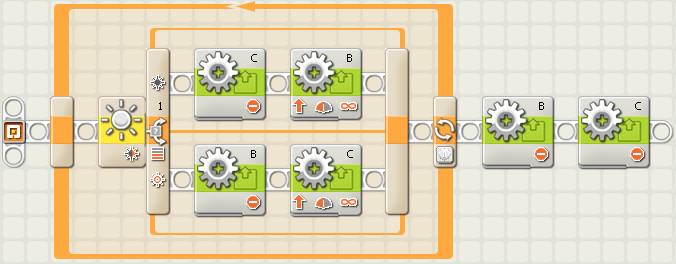
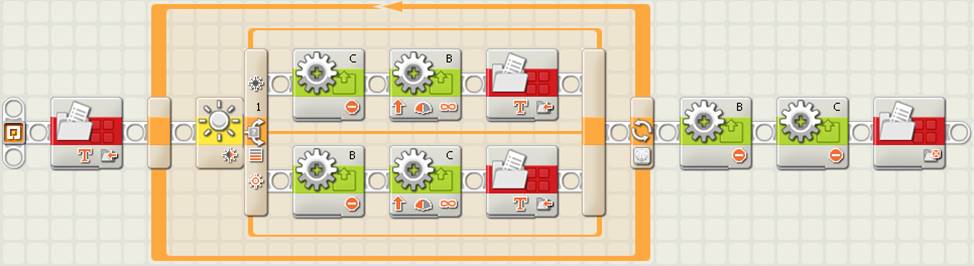
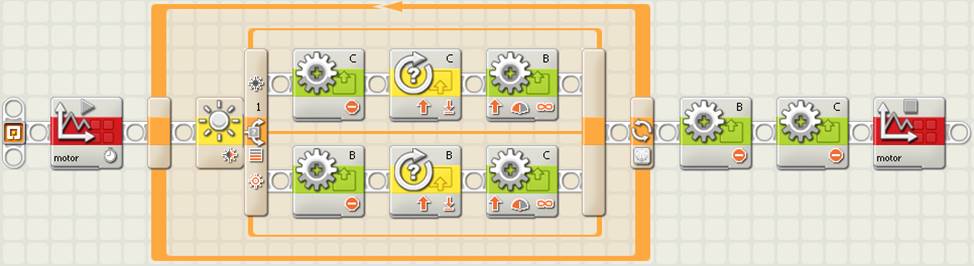
Two-step simple line follower with one light sensor (NXT)
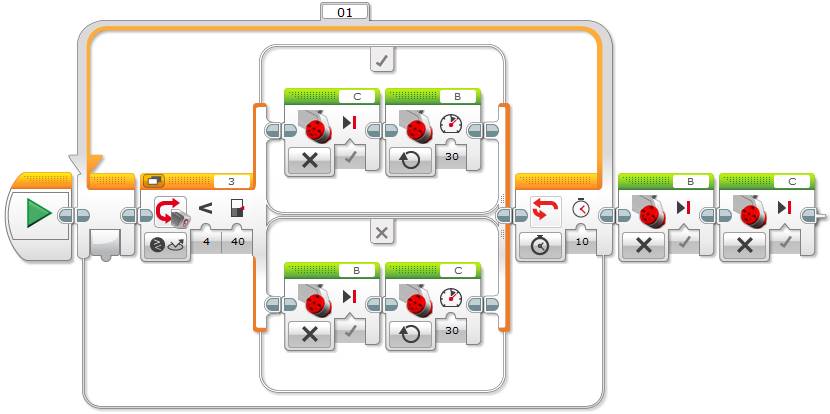
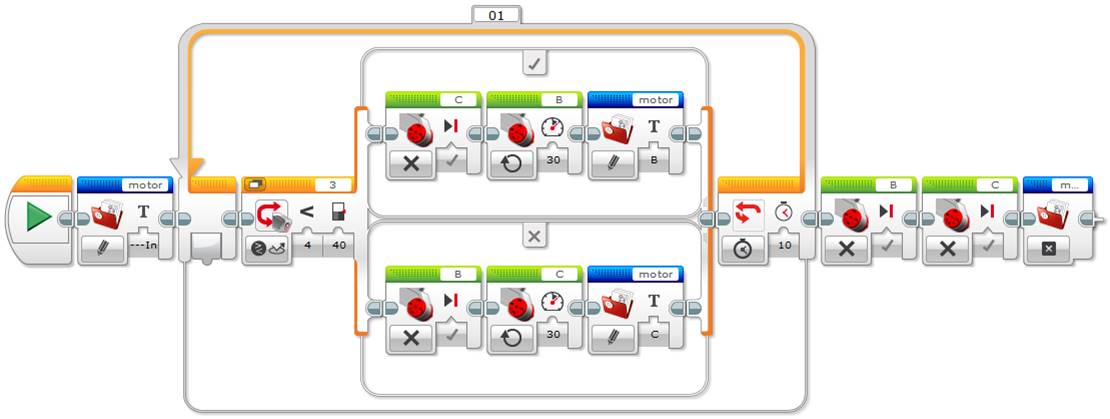
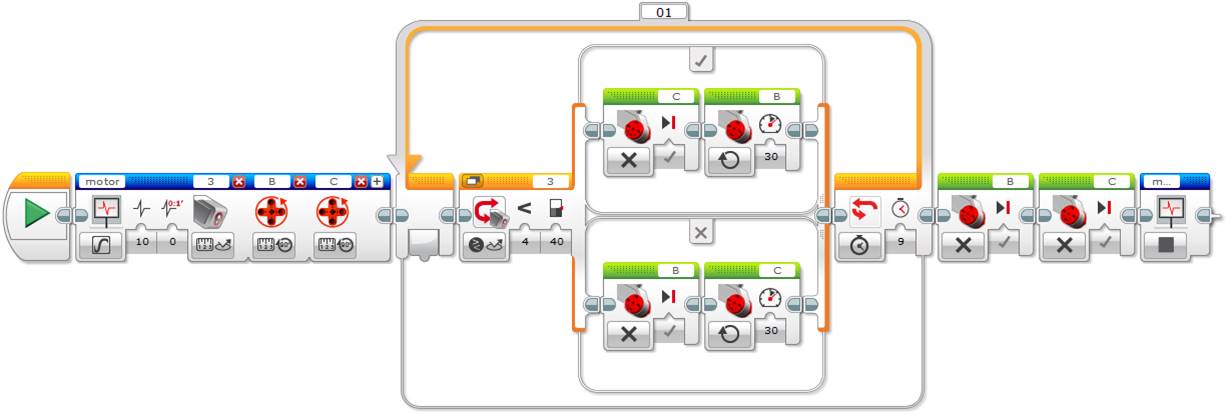
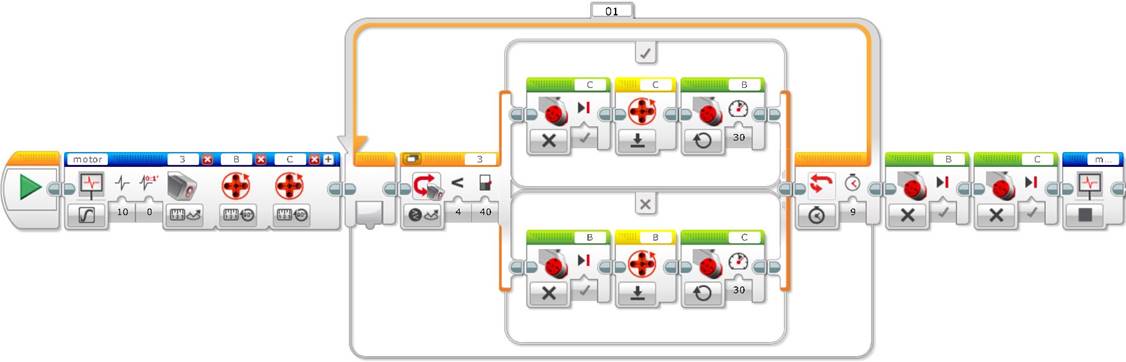
Two-step simple line follower with one color sensor, with Motor blocks (EV3)
Two-step simple line follower with one color sensor, with Move Tank block (EV3)
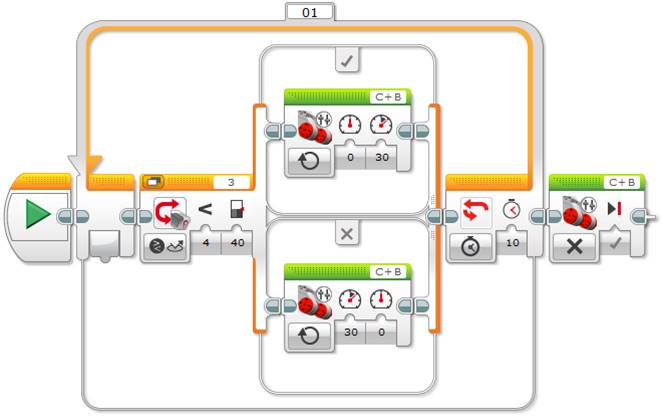
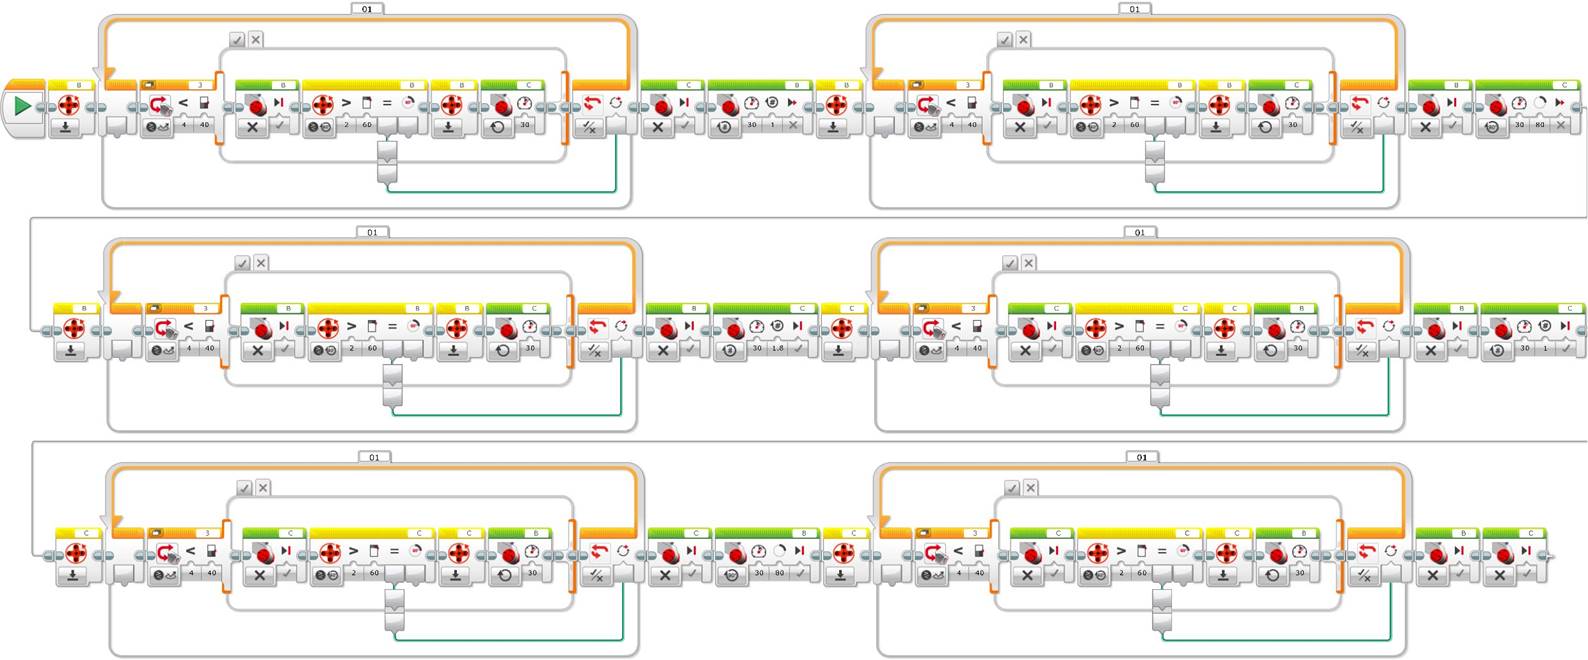
In the previous examples the motors are configured with 40% power in NXT and 30% in EV3, to avoid swerve movements, and the time loop runs during 10 seconds. In EV3, the Switch block is associated to the Color sensor in the “Compare – Reflected Light Intensity” mode. In the next example, the Color sensor uses the “Measure – Color” mode to measure the color.
Two-step simple line follower with one color sensor, with “Measure – Color” mode (EV3)
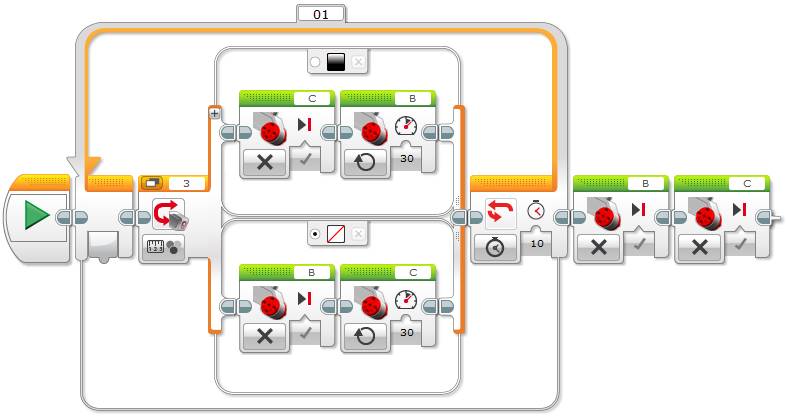
Tip: When using the Color sensor with the “Measure – Color” mode, to measure the color, it is important to select the switch default case, for example, the white color. We can also select “No Color” as default in such a way that any detected color by the Color sensor not being black will execute this case. How will the robot behave if we do not configure the “No Color” case as default? Well, since you need to select a default case, the only other option will be to select the black color case, thus the program will always execute this branch, even while detecting white, because any detected color is different from “No Color”! It is important that the students make tests to understand how the Switch block works.
At this point it is important to make the students give their opinion and, for example, make them replicate the robot behavior with their body. We will see that the majority of them do not clearly understand how the algorithm operates, and if they do not think about it, they will say that while the loop runs, the program executes one switch’s branch at a time. We will see that this is completely incorrect, the program goes many times through the same option or switch’s branch meanwhile the robot tries to go from one color to the other, even if by observing the robot we feel that its movement is extremely fast. The following exercises show with a lot of detail how the switch inside the loop algorithm works for the two-step simple line follower with one light or color sensor.
Unit 6 exercise 1: Data logging using file access: a numerical and manual debugging strategy.
The simplest idea to demonstrate that the intelligent brick executes the program much faster than the robot’s apparent physical execution of the same program is to record the switch branch that is being executed in each iteration of the loop.
This exercise uses a “File Access” block to record in a text file the switch branch that the program has just executed. The finality is to check the final generated text file.
Create a new program, for example “u6ex1.rbt”, copy the pedagogical unit 5 initial line follower basic algorithm and add the blocks “File Access”, as shown below.
Simple line follower program with “File Access” blocks (NXT)
Simple line follower program with “File Access” blocks (EV3)
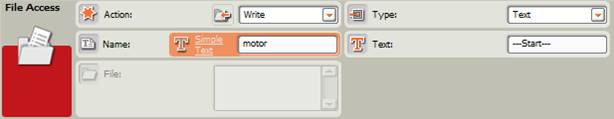
First we need to add an initial block configured with the “Write” action to write to a file, the name of the file we want to create, for example “motor”, the type of information we want to add, choose the option “Text” of the “Type” pulldown menu, to add an initial text “---Start---”, that will help us to know when the data logging starts in the text file.
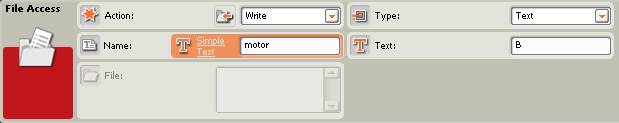
Next we will add two “File Access” blocks similar to the previous one at the end of both branches of the switch to write in the file the branch that the program just passed through. For example, when the program goes through the option where the motor B runs we will add “B” and when it goes through the other option we will add “C”, in the textbox “Text”.
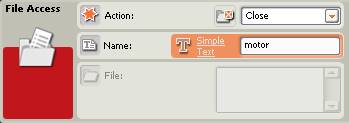
To finish the program, we need to close the file before stopping the program. For this we need to add a final block with the action “Close” to close the file. Be careful to always write in the appropriate filename, “motor” in our case. To avoid errors, a good option is to copy any previous block and modify the desired options.
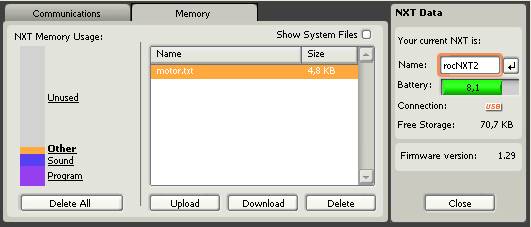
Once the program has been compiled and executed by the robot, connect the robot to the computer to find the generated file. For this click on the button that opens the NXT window and go to the “Memory” tab. Then choose the option “Other” memory to find the text file “motor.txt” in NXT.
Intelligent brick NXT window with memory management tab
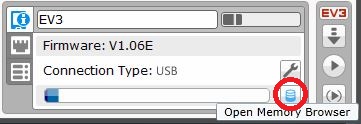
In EV3 click on the “Open Memory Browser” button in the program’s window lower right corner to open the EV3 memory management window where we will find the text file “motor.rtf”.
Button to open the intelligent brick memory management (EV3)
Intelligent brick memory management window (EV3)
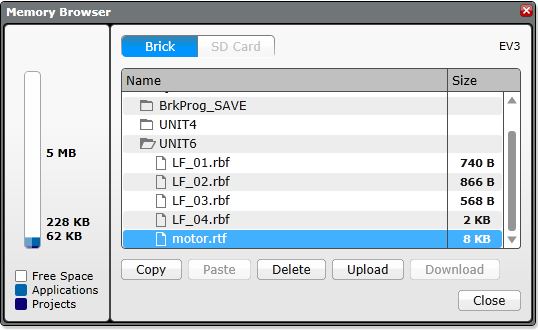
Now just upload the file from the intelligent brick, by clicking on the “Upload” button, and save it in the computer to the desired location.
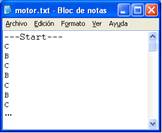
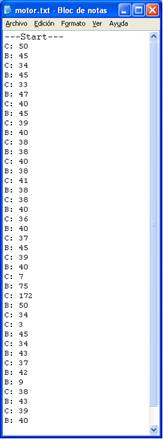
The final step is to open the “motor.txt” file (e.g. with “Notepad”), or “motor.rtf” (e.g. with “Word”) to view its contents. Observe that the generated text file has an extension “.txt” or “.rtf” that the program adds. Before opening it, it can be interesting to ask the students about what they think its contents will be and make them fill in the file manually on the black board. As we have mentioned before, the students who think that, meanwhile the robot goes from one color to the other, each switch’s branch will be executed only once will write in the file: “B, C, B, C, B, ...”, as shown in the following image.
Supposed contents of the “motor.txt” or “motor.rtf” file
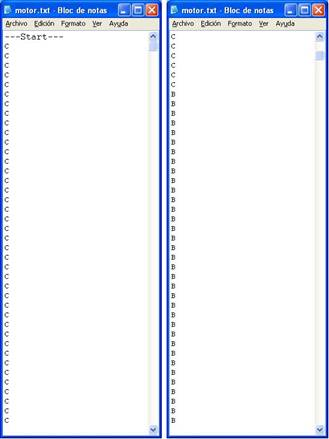
When opening the file and contrarily to the intuition of many students, meanwhile the line follower loop runs we can observe that each letter is repeated many times, indicating that the program goes through the same switch’s branch many times before changing the branch inside the loop. Thus, the program executes the loop much faster than the robot movements, as shown in the images below.
Real contents of the “motor.txt” or “motor.rtf” file
The next challenge is to count how many degrees each motor turns before changing the branch of the switch inside the loop. Each motor turning degrees mainly depend on its power, as well as on the robot design, that in our case it is always the same for all the students. Initially we will suppose a power of 40% in NXT and 30% in EV3 to avoid the robot slipping. To accomplish this we will explicitly use the internal rotation sensor of each motor.
An important aspect before starting the exercise is to ask the students where to add the internal rotation sensor blocks of each motor. Given that the program passes through the same switch branch several times before changing branch inside the loop, as it has been proved, it is important to realize that we need to record the rotations of a motor just before changing the active motor in the switch.
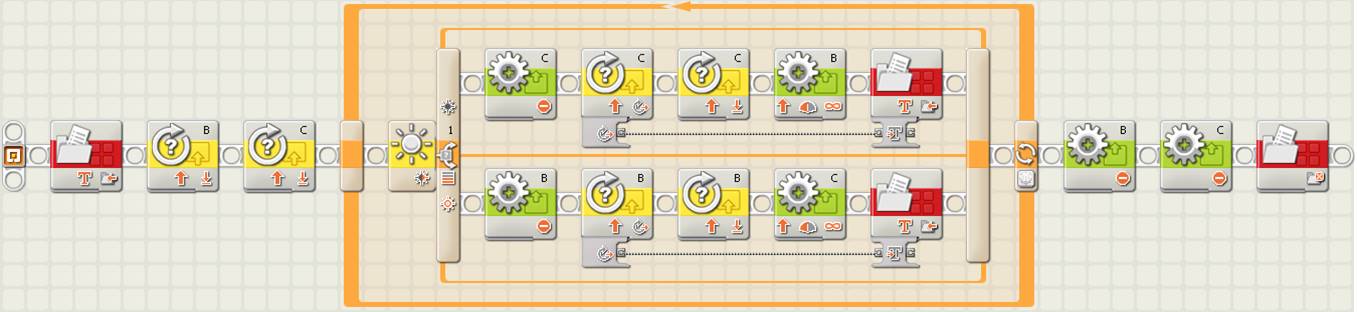
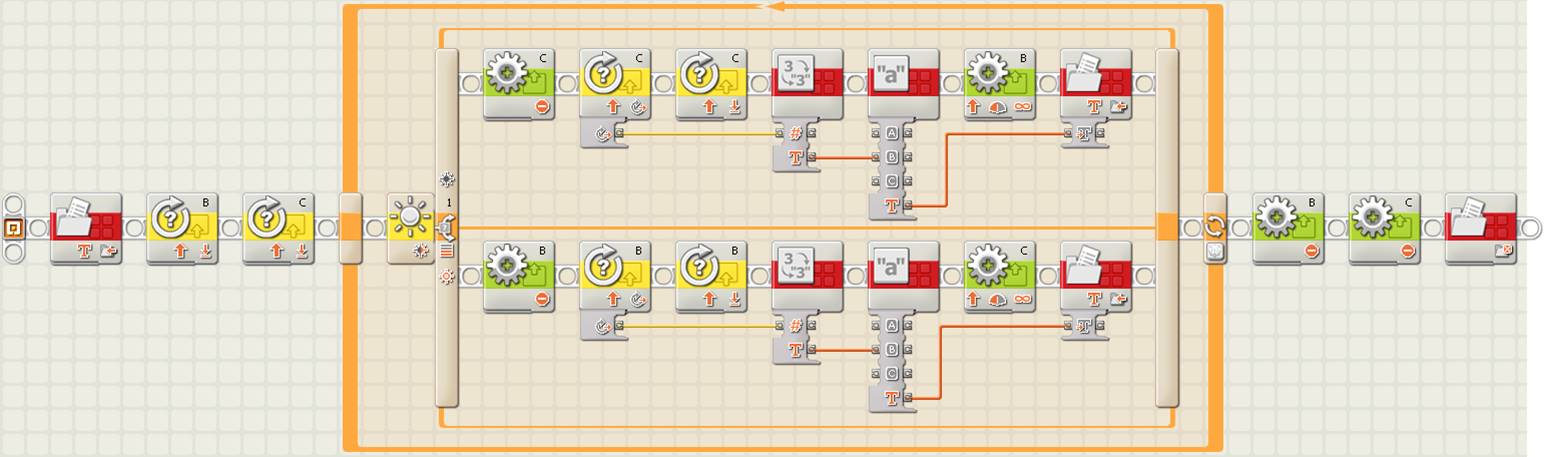
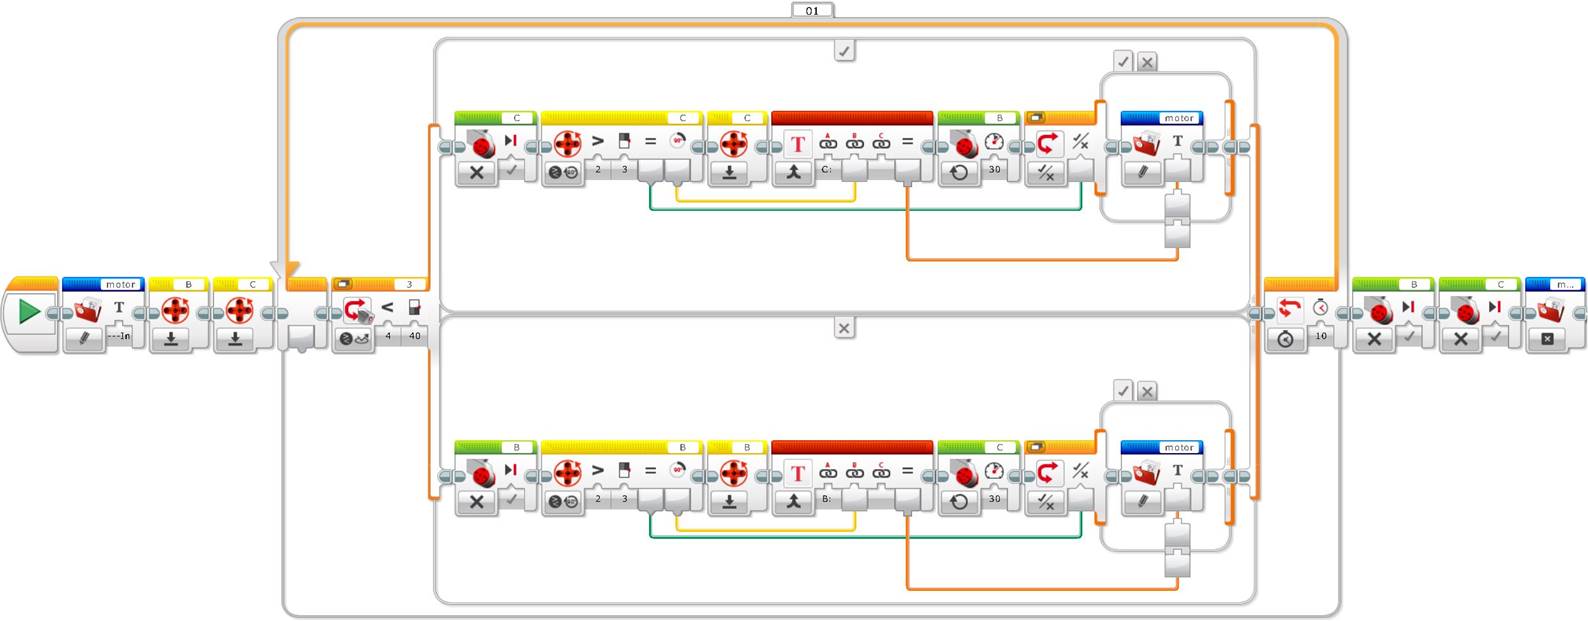
The following image shows the previous line follower program where internal rotation sensor blocks for each motor have been added. It is important to realize that when a motor stops we need to count its rotation degrees, we need to reset the sensor, and finally, we need to record these rotation degrees in the text file. To accomplish this process we need to connect the data hub plug coming out of each motor internal rotation sensor block, corresponding to the motor degrees of rotation, to the corresponding “File Access” block data hub text plug in.
Initial line follower program with file access and internal rotation sensor blocks (NXT)
In this image we can see that the data wire connecting the motor rotation degrees with the file access block data plug in is not valid, it is broken, shown in gray color and with a dotted line. This is due to the fact that the types of data we want to connect are different, the first one is numeric and the second is text. Thus we need to either change the file access block data type to numeric, or convert the motor blocks rotation degrees from numeric type to text type. This second option requires a new block called “Number to Text” that allows to convert a numeric type into a text type.
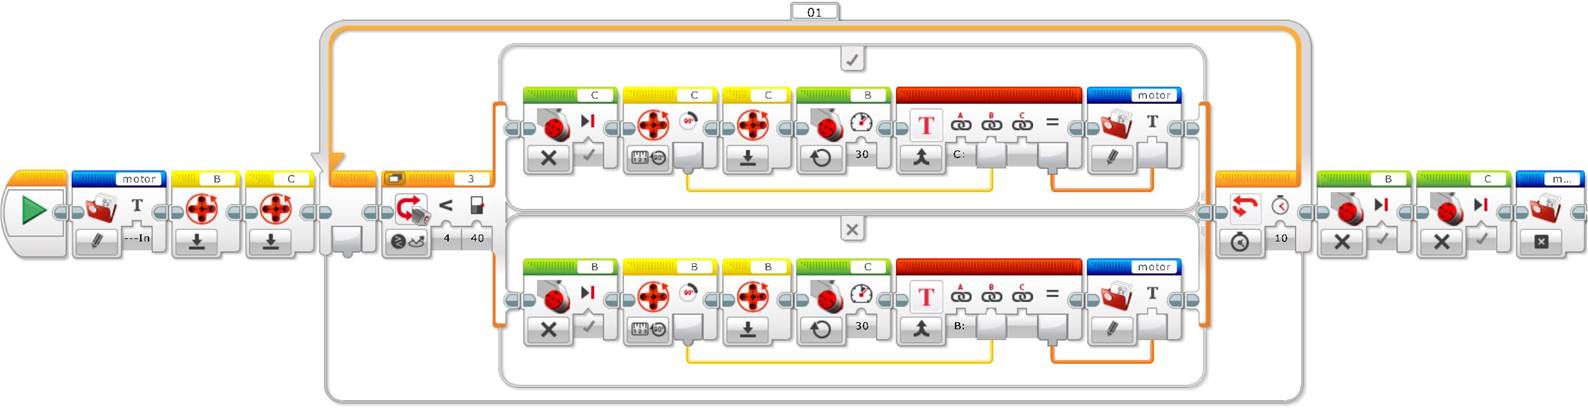
Initial line follower program with file access and internal rotation sensor blocks (EV3)
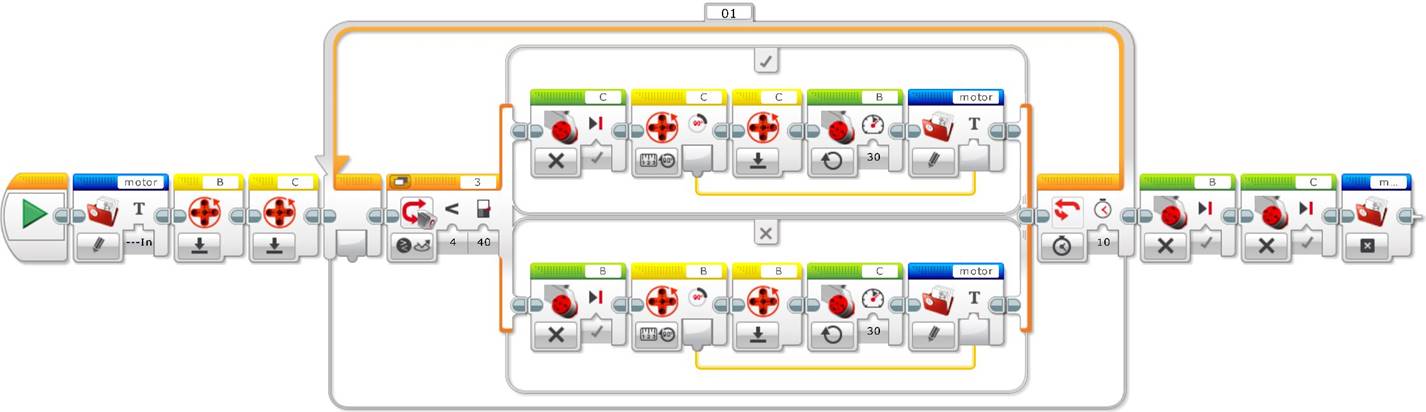
As we can see in the previous image, in EV3 the “File Access” block is capable of automatically converting the rotation degrees numeric values into a text string and we do not need to use a conversion block.
But have we obtained the desired result yet? If we analyze in some detail the result we want to obtain in the text file, we will see that we not only need to record the rotation degrees, but we also need to record which motor has turned these degrees. Otherwise, we will obtain a bunch of numbers and we will not know which motor they refer to. For this, we need to add the letter of the motor “B” or “C” to the rotation degrees in each case. Thus, we need to add a new block to concatenate these text strings. This block is called “Text” and allows concatenating up to 3 text strings.
Tip: It is interesting to observe that every time we use the file access block, this writes a new line into the data logging text file. Thus, if we do not concatenate the text strings and we use the “File Access” block two times in a row, one for each text, we will obtain the motor letter and the rotation degrees in different lines, which will make it difficult to read the datalog file.
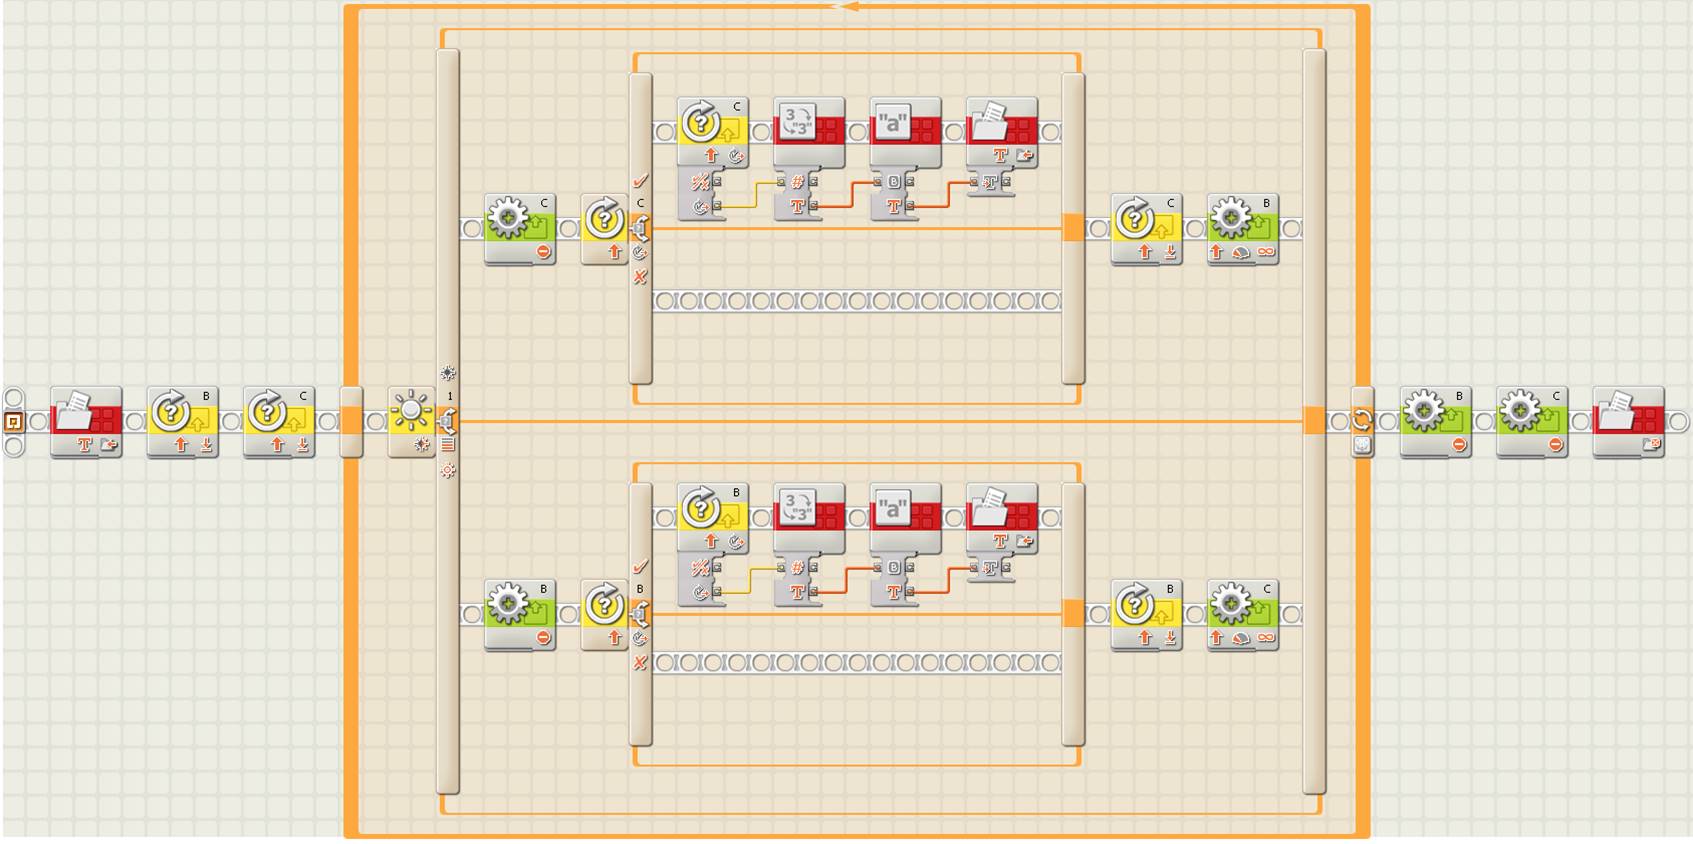
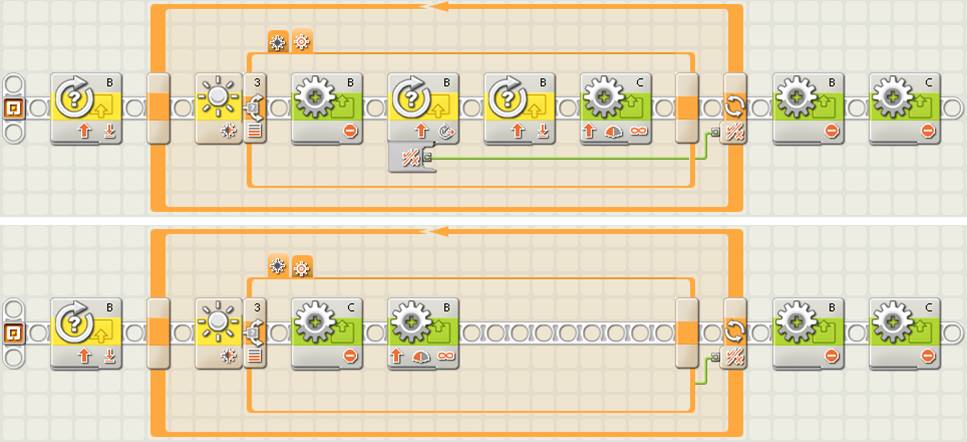
Correct line follower program with file access and internal rotation sensor blocks (NXT)
Correct line follower program with file access and internal rotation sensor blocks (EV3)
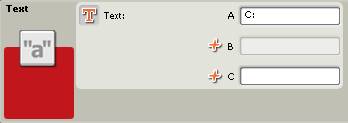
As mentioned before, when recording the data in the text file we can observe that, to distinguish each motor rotation degrees, the motor is shown as well as its rotation degrees. For this, in NXT we need to convert the rotation degrees into text, with a “Number to Text” block, and we need to combine this text with another one that shows the corresponding motor, by means of a “Text” block, for example using the text string “B: ” or “C: ” for each case, as shown in the following image.
“Text” block attributes example to concatenate string “C: ”
with motor “C” rotation degrees connected to the
“B” data plug of the “Text” block data hub
Next, compile and download the program in the robot and before executing it, it is important to delete the previous text file from the memory to avoid adding data and incrementing its file size. If we do not delete it, we will easily find each test start by locating the initial text string that the program adds just before starting.
Tip: Every time a data log is generated with the same name, its size gets incremented, and that can end up by filling up all the intelligent brick’s memory. Thus, before the robot executes a program that generates a data log, it is important to delete the previous file from the memory to avoid the program adding data and incrementing the file size, whenever the previous data is not important. If you want, this can be achieved programmatically by adding a “File Access” block at the beginning of the program with the action “Delete” and selecting the appropriate filename.
Finally, upload the “motor.txt” (NXT) o “motor.rtf” (EV3) file corresponding to the data log to observe and analyze its contents. Before opening the file, ask the students to specify with the maximum detail possible what its contents will be.
“motor.txt” o “motor. rtf” file contents with each motor’s rotation degrees
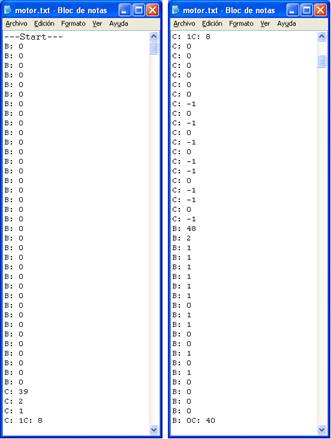
As we expected, we can see that every file entry which captures each motor rotations just before changing the switch branch inside the loop, contains rotation degrees that range from 30 to 50 degrees.
But the question is why there are some entries equal to “0” or very small, “1” or “2”? The answer is very simple, when we count the rotations of one motor the switch writes in the file the rotations of the opposite motor, which is obviously stopped. If this motor slips a little bit it might actually make one or two degrees of rotation, or it can even slip backwards, and that implies negative degrees, e.g. “-1”!
How can we improve our data logging file? We need to eliminate all the data from it that does not provide meaningful information. For this we need to use the internal rotation sensor comparison attribute or threshold value of each motor, compare it to the values we want to record, for example only the ones bigger than 3, and finally, record only these data for the desired case.
To record only the desired data, one less efficient solution that students should be able to find by themselves with the acquired knowledge, is to use a switch associated to the appropriate internal rotation sensor. It is important to leave the students find this solution, or at least part of it.
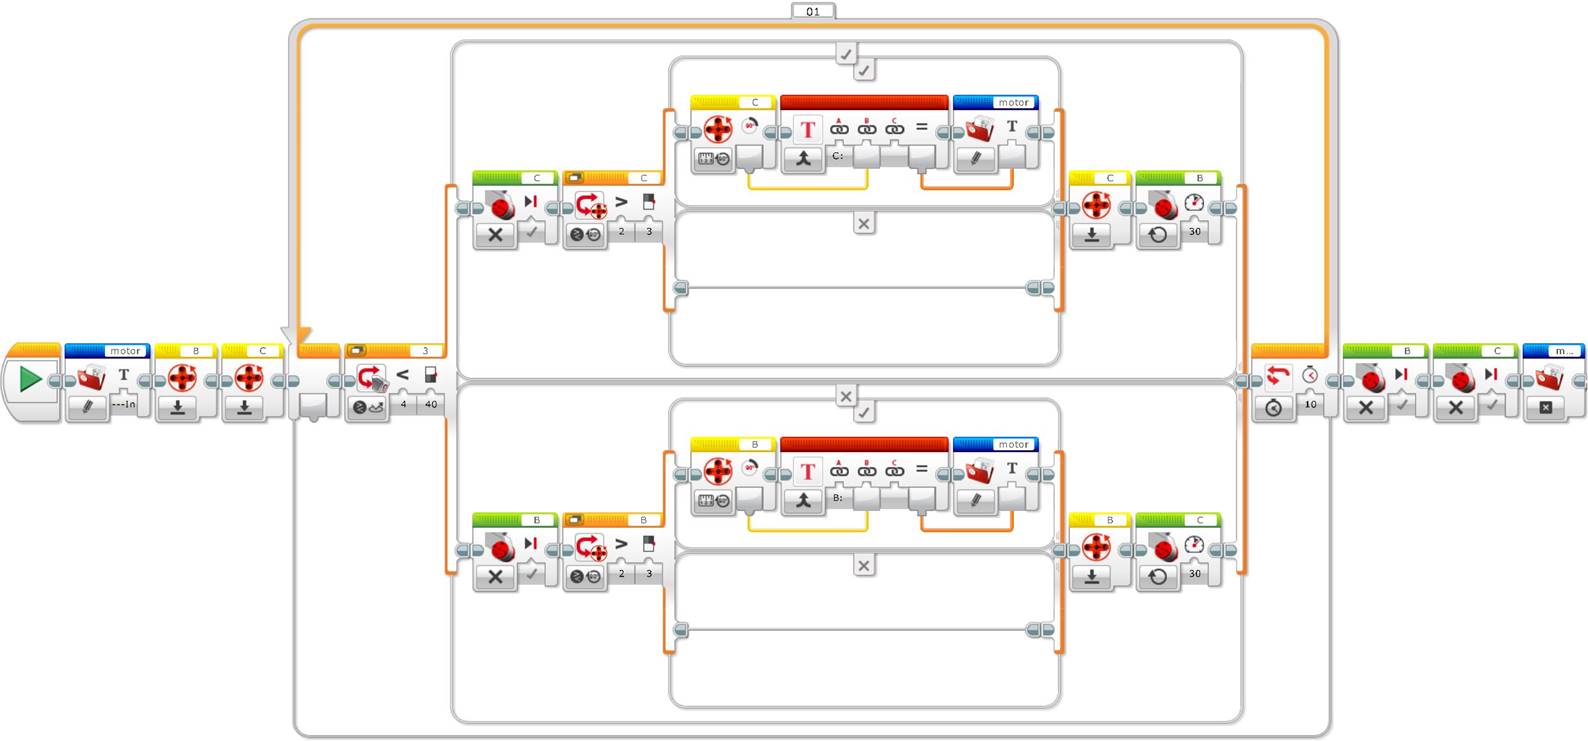
Line follower program with a strategy to avoid null rotations, with file access
blocks and a switch associated to the internal rotation sensor (NXT)
Line follower program with a strategy to avoid null rotations, with file access
blocks and a switch associated to the internal rotation sensor (EV3)
A more efficient strategy to record only the significant data is to use the internal rotation sensor logic plug out “Yes/No” specifying the desired rotation degrees threshold, for example bigger than 3, and connect this data plug out to a logic switch data plug in to record in the file only the values bigger than the specified threshold. Finally, to connect the text of the “File Access” block with the motor rotation degrees we need to “cross” the switch, what can be only accomplished by unselecting its “Flat View”.
Tip: Switches can be visualized with a split sequence beam under the so called “Flat View” or in the shape of “Tabs”. If a switch is associated to a sensor or it is a logic type, then it has two values, but later on, we will see that a switch can handle several values, in this case, in NXT, these can only be visualized with flat view unchecked, with a tab view switch. Each option is accessible by clicking in the appropriate tab. Finally, to connect the attribute of a block located outside the switch with the attribute of another block from inside the switch, the “Flat View” needs to be unchecked to be able to “cross” it with a data wire.
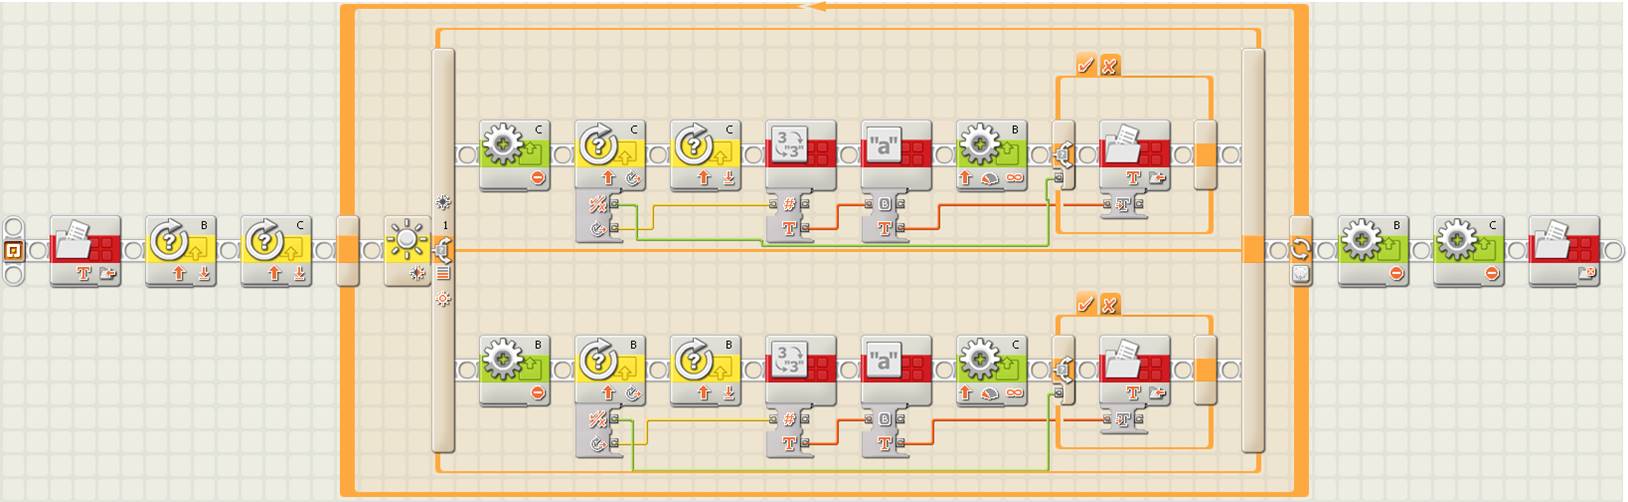
Line follower program with file access blocks, internal rotation sensor blocks
and efficient strategy to avoid non-significant rotations (NXT)
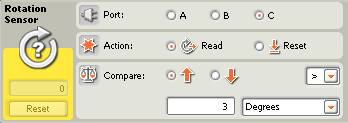
Attributes window of motor “C” internal rotation sensor (NXT)
Line follower program with file access blocks, internal rotation sensor blocks
and efficient strategy to avoid non-significant rotations (EV3)
But why is this programing strategy more efficient than the previous one? This program is more efficient than the previous one because it writes to the file at the end of the switch branch after activating the opposite motor, because it uses a logical switch faster to execute than one associated to a sensor, and because it does not duplicate blocks unnecessarily.
Once the program is completed, compiled and executed by the robot, the file “motor.txt” or “motor.rtf”, corresponding to the data logging record, only shows the rotation degrees accomplished by each motor while following the line.
“motor.txt” or “motor.rtf” file contents only with
relevant rotation degrees of each motor
Is there anything that calls the attention in this file? Why is there a point where the rotations are bigger than in the general case? Can we identify this point on the field? This example, run on the incremental exercise field, where the robot follows the line on its internal side, and during a line following time that allows to surpass the first intersection line, numerically illustrates the point where the robot crosses this intersection line. This point corresponds the biggest rotations, that is, B=75 and C=172 to recover the line following path.
Thus, we have just designed a strategy to make a two-step simple line follower with one light or color sensor more intelligent, by tracking each motor’s rotations, so as to make it capable to knowing when it encounters a line intersection!
Unit 6 exercise 2: Data logging: a graphical debugging strategy.
To complete the exercise about data logging, we can redo it but this time using the program functionality called “Experiment”, which allows recording data captured by the sensors in a function of time and visualize it in a graphical and uniform way under a specially designed interface.
As previously mentioned in other pedagogical units, the data logging record through the concept of experiment can be basically executed in two ways: in real time, from the program interface, or after running the experiment, by programmatically downloading the program into the intelligent brick and executing it to finally studying the generated file by the intelligent brick from the computer. To watch the captured data from the data logging record in real time, the intelligent brick must be connected to the computer. Then, meanwhile the experiment proceeds, the user sees the data capturing process in real time and graphically. In addition, the program offers a second option that allows defining and executing the data logging from inside a program, by means of two specific blocks in NXT, “Start Datalog” and “Stop Datalog”, and only one block in EV3, “Data Logging”. The advantage of this second option is that it allows carrying different data logging records inside the same program and in function of the needs. The experiment configuration is identical in both dynamic and programmatic cases.
Although the experiment can be run dynamically, in this unit we will do it programmatically for simplicity. This exercise uses the blocks “Start Datalog” and “Stop Datalog” in NXT and the block “Data Logging” in EV3 to record in a text file with a “.log” or “.rdf” extension the sensors readings of light or color and internal rotations associated to motors “B” and “C”. The goal is to graphically observe the run experiment in the specific program window to visually relate the generated curves.
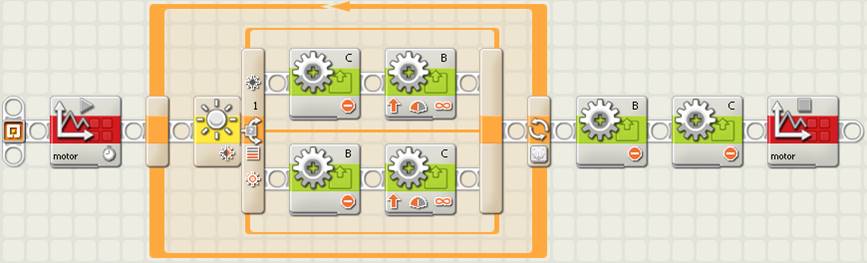
To start coding, create a new program, for example “u6ex2.rbt”, copy the pedagogical unit 5 initial line follower basic algorithm and add the data logging blocks, as shown below.
Line follower with “Start Datalog” and “Stop Datalog” blocks (NXT)
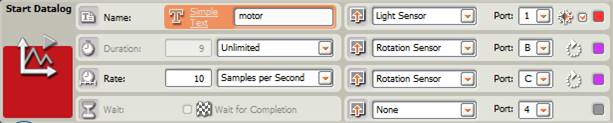
“Start Datalog” block configuration (NXT)
Line follower with “Data Logging” blocks to start and stop data log recording (EV3)
When configuring the start data logging block it is important to pay attention to different aspects. You need to give it a name that will be used later to stop the datalogging with the corresponding block that will generate the file with the experiment and with the “.log” extension in NXT and “.rdf” in EV3, in our example “motor.log” o “motor.rdf”. You need to define the duration to “Unlimited” or “On” to pass the time control to the loop that will repeat during 9 seconds –this allows starting the datalogging to start and immediately after start the robot line following–, and the rate with the number of samples per second to 10.
Alternatively in NXT, we can define the experiment duration in seconds, 9 in our case. But if we do so, it is very important to uncheck the attribute “Wait for Completion”, so as to make the robot execute the line follower program meanwhile the different sensors readings are being recorded. If we do not do it, the robot will wait until the data capture finishes, to start following the line, what will prevent the file to contain the desired data.
Finally, we have to configure the desired sensors’ data capture, until a maximum of four in NXT. First we have to add the light or color sensor and after this the internal rotation sensors associated to each motor. In NXT just leave blank the fourth data log recording option, in EV3 we can add sensors by clicking on the upper right “+” sign icon of the block. Observe that the internal rotation sensors units are degrees and not rotations, later on we will see the difference.
Once the experiment configuration is finished, connect the robot to the computer and compile it, download the program to the intelligent brick and make the robot execute it, having previously disconnected the robot from the computer. You need to place the robot in the same field of the previous incremental exercise to be able to compare the results. Once the robot has completed the line following exercise, connect it to the computer, and from the experiments interface, open the generated “.log” file in NXT, “motor.log”, or the “.rdf” file in EV3, “motor.rdf”, by clicking on the upper arrow icon, in the application lower right corner, to do a file “Upload”. We will see that the window allows loading the “.log” or the “.rdf” file from the computer or directly from the intelligent brick, by selecting it from the list. In the lower part, the window shows the available files to select. In our case, select the file “motor.log” in NXT or “motor.rdf” in EV3.
Tip: In NXT, the “.log” files are text files that not only you can open and delete from the experiments graphical interface, but also, you can manage them from the NXT window, as we have done in the previous exercise with the text file. The “.log” text files are located in the “Other” folder of the intelligent brick memory and can be opened with the computer’s Notepad or with a spreadsheet. In EV3, the “.rdf” files are binary files that can be only opened from the application. These files have a specific structure that allows making an “intelligent” reading of them.
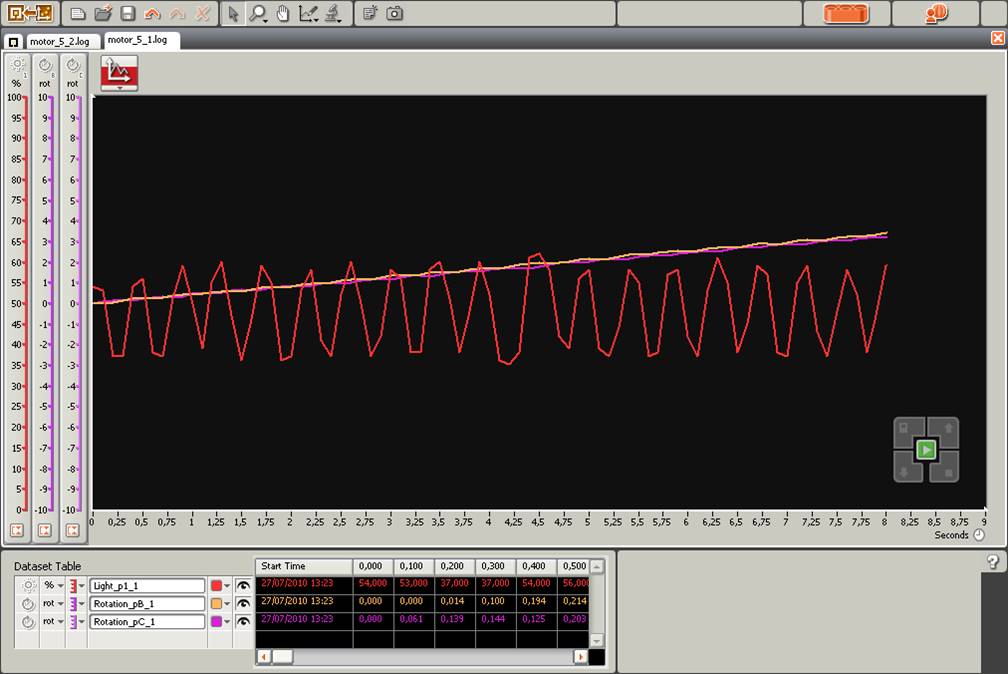
“.log” file with rotation sensors units expressed in rotations (NXT)
“.rdf” file with rotation sensors units expressed in degrees (EV3)
This first datalogging file shows the data recorded from the light or color sensor in red and the rotation sensors in purple. To better read the graph, we can change the color of one of the rotation sensors by clicking the color corresponding square.
If we analyze the results, we will see that in NXT it is a little bit difficult to differentiate each motor’s rotations. It would be better to use degrees instead of rotations to express the motors movement and to obtain more relevant differences, but why? Because 1 rotation is equivalent to 360 degrees, that is 360 units, thus the differences are bigger. In EV3 the system chooses automatically this option. We can select the units, rotations or degrees, on the left side of each curve in NXT and on the “Dataset Table” tab in EV3. We can also choose the default desired units in the “Start Datalog” block attribute definition, as explained previously and as shown in the previous block attribute definition image.
It can be interesting to let the students test different units to better adjust the curves visualization, and take into account that in EV3 you can even manually modify the coordinate system minimum and maximum values by writing the desired value in, and this cannot be done in NXT.
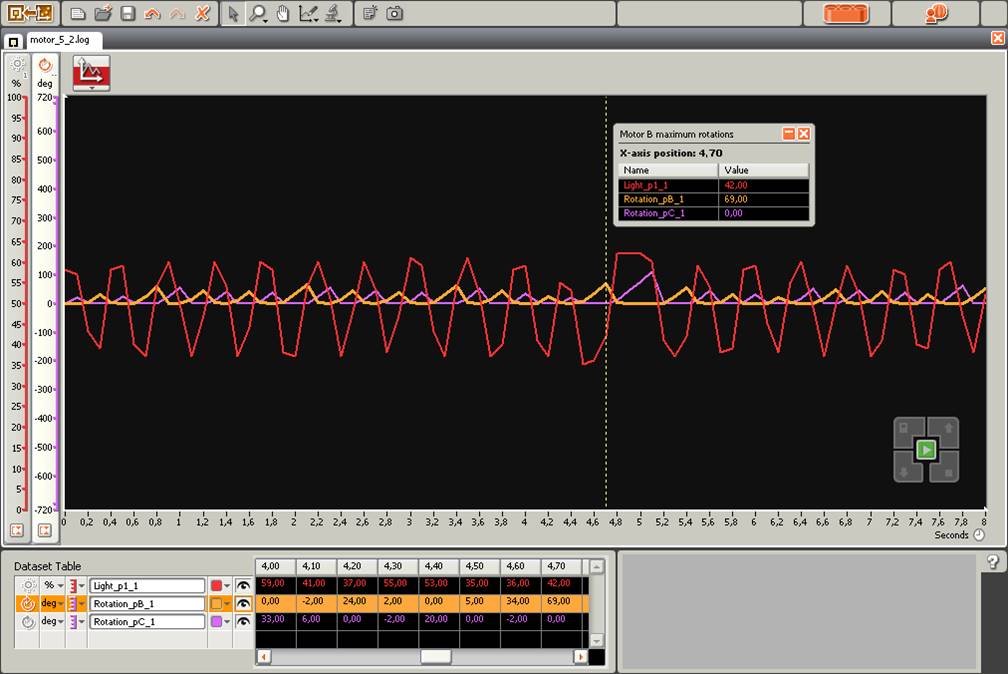
“.log” file with rotation sensors units expressed in degrees (NXT)
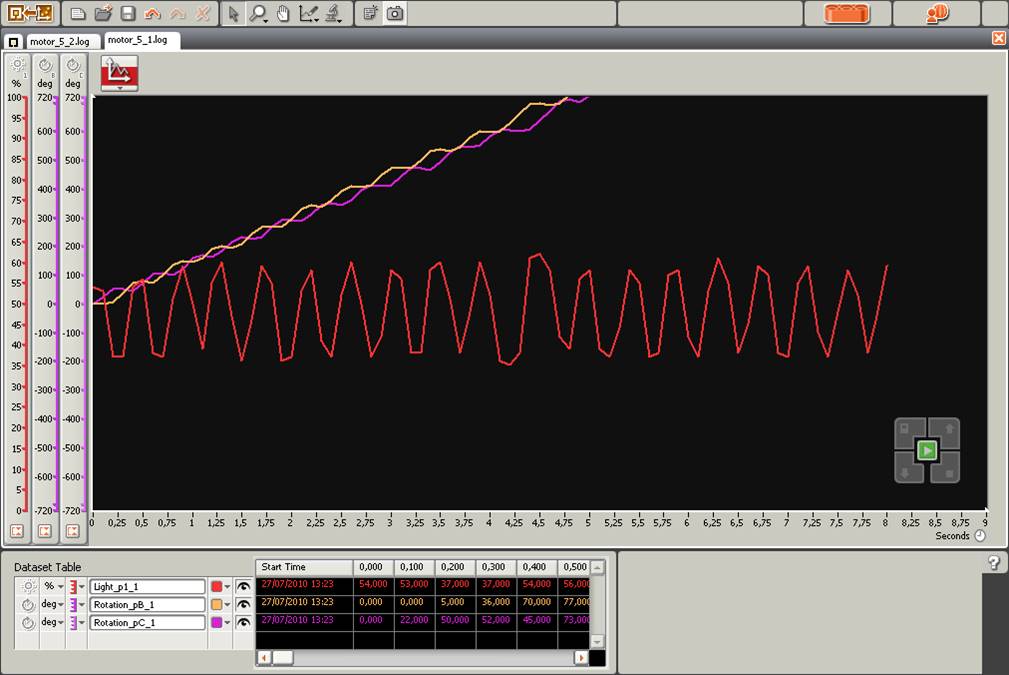
This second graph is more readable. It is important to make the students interpret and explain the generated graph relating the different curves. First we can observe the light or color sensor readings in red, which range from black to white (see the reflected light intensity in the Y axis). One first question is why are the lines inclined in a “toothed saw” shape and not vertical? The answer is that near the threshold between the black and white colors, the light or color sensor detects progressive changes of the reflected light intensity while the robot goes forward from one color to the other. See the pedagogical unit about the concept of a threshold study for more about this topic.
In relation to the motor curves, we can ask the students why the corresponding curves have an “S” shape that tends to go up. The answer is because, on the one hand, when a motor starts the other one stops, and on the other hand, the rotation sensors accumulate rotations, and thus, the line has a positive trend.
Finally, if we observe the light or color sensor curve, we can see that up to a certain point there is a higher peak. What does it correspond to? This peak corresponds to an intersection on the line the robot follows, that in our case, it is the filed middle line of the incremental exercise. If we pay attention, even if it is a little bit hard, we can also see that the motors’ rotation degrees, especially the “B” ones in orange color, look also bigger in the vertical of this same point, which approximately corresponds to the second 4.5.
To finish the exercise, what do we need to do to obtain only the rotations the robot does when changing the color in the loop iterations? To obtain only the rotations that each motor does in each switch phase inside the loop, we only need to reset the internal rotation sensors after stopping them inside each branch of the switch, by using the corresponding internal rotation sensor block.
Line follower with data logging blocks and reset of each motor internal rotation sensors (NXT)
Line follower with data logging blocks and reset of each motor internal rotation sensors (EV3)
Before executing this exercise it can be interesting to ask the students what will be the differences between this new graph and the previous one. As we can see below, the graph corresponding to the new program allows interpreting much better the results obtained.
“.log” file resetting the motors internal rotation sensors and with units expressed in degrees (NXT)
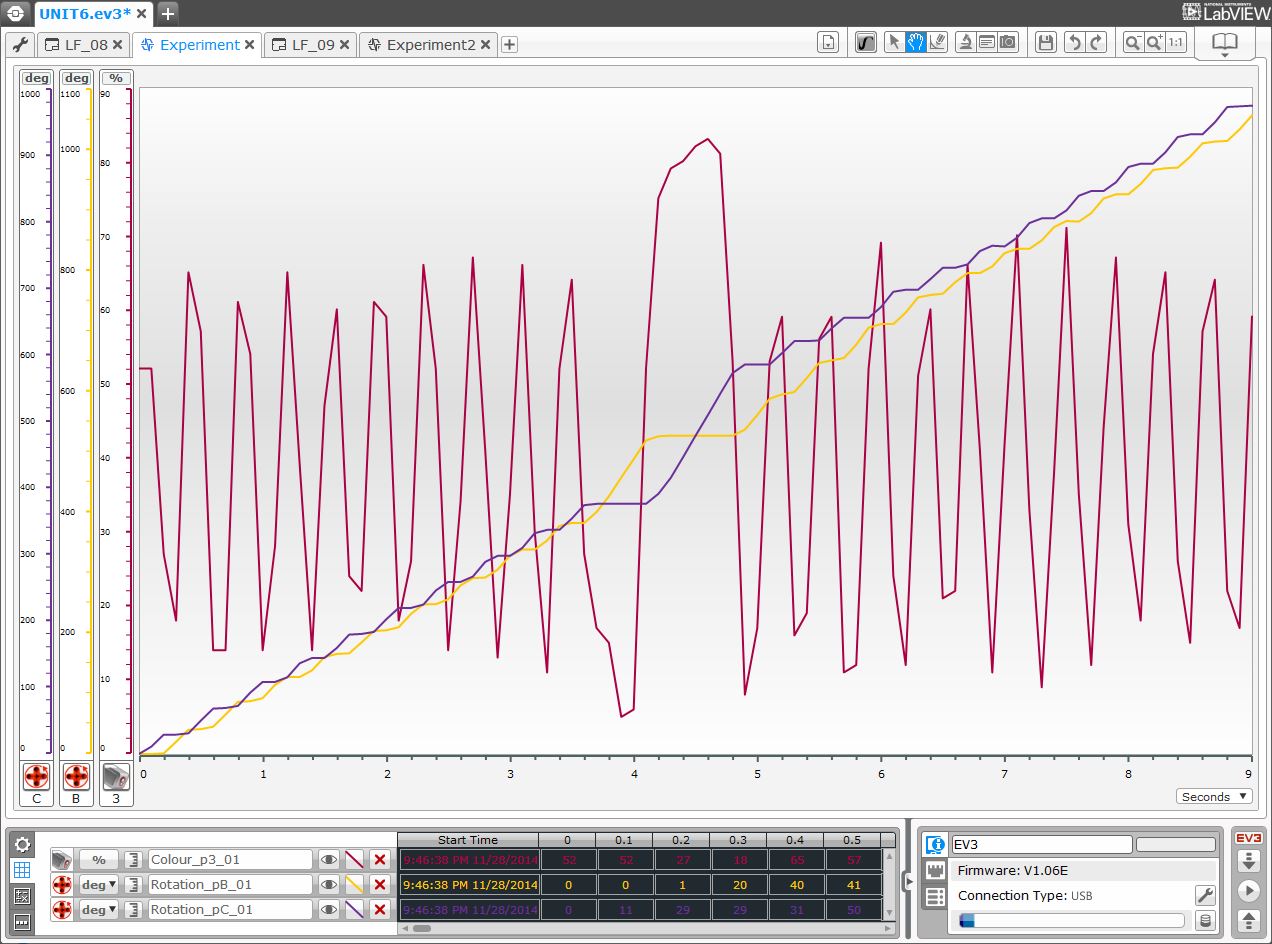
“.rdf” file resetting the motors internal rotation sensors and with units expressed in degrees (EV3)
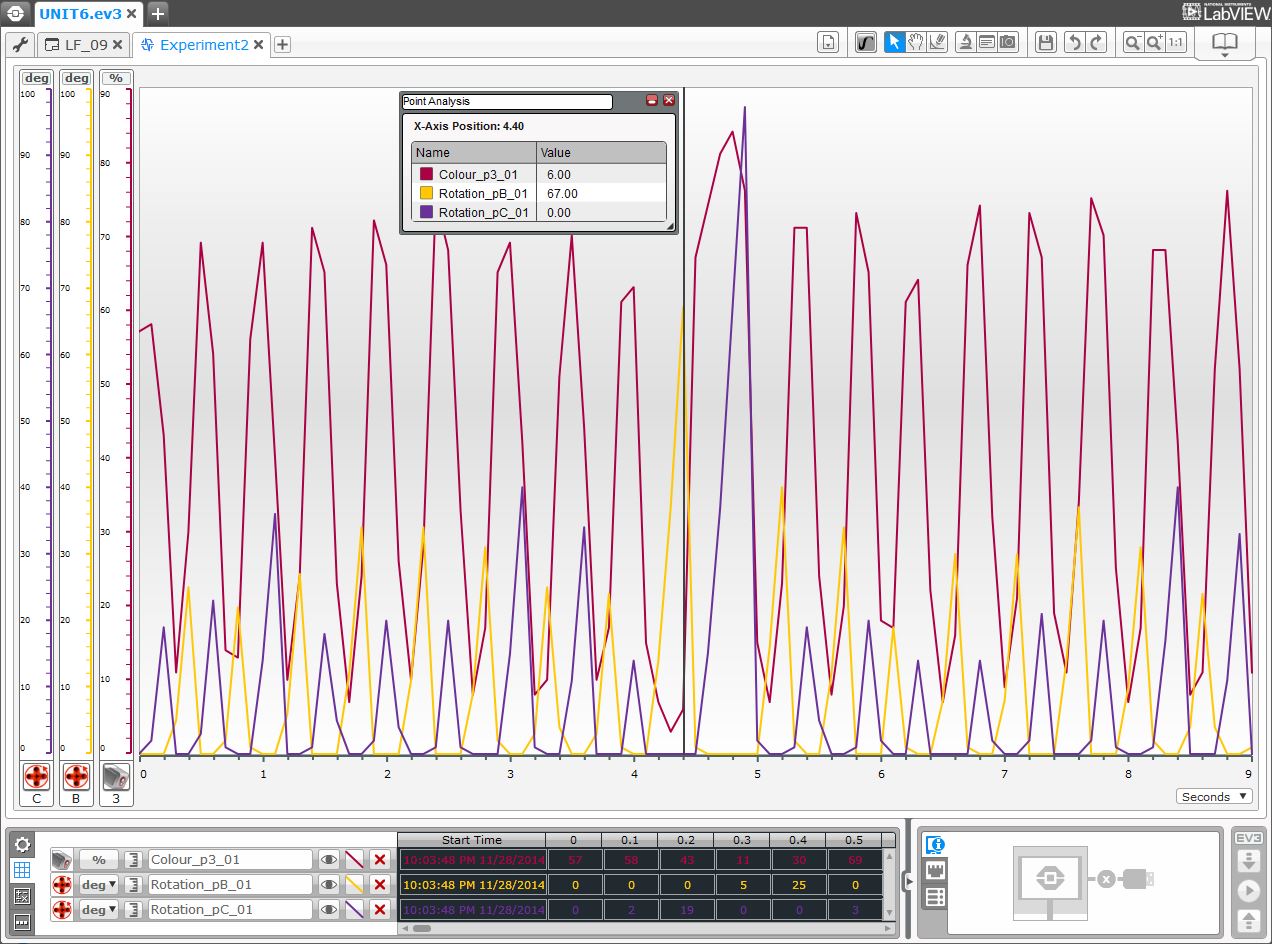
Given that the motor turn is reset between each line follower switch branch of the loop, the previous graph shows only the degrees turned by the motors inside each branch, which is exactly the information we are interested in to find out the point of the field where a line intersection lies.
At this point it is interesting to ask the students to interpret the results. In the graph we can see that the motors rotation degrees also show a “toothed saw” shape curve and that the curves of each motor alternate, given that when a motor runs the other stops (or almost, because it can slip), corresponding to the cycles between the field background white color and the black color of the line to follow. Finally, we can observe that the peaks corresponding to the internal rotation sensors do not correspond exactly with the peaks of the light or color sensor, why? This is due to the robot inertia and to the program and sensors readings execution speed, when each motor is reset it is just when the color changes according to the specified threshold between white and black. Thus, each motor internal rotation sensor curves peaks tend to coincide with a point previous to the “rise” or “descent” of the color curve, that is, with the color change threshold between white and black. If we take many more samples per second this fact would be more obvious and, in fact, if the program was very fast, the internal rotation sensors curves will show a completely vertical descent, because the motors stop at this point.
Another fact that we can observe in the example is that motor B seems to make a little bit more rotation degrees than motor C through the whole robot’s path. In EV3, make sure that the graph’s maximum rotations of both sensors are the same, if they are different, as seen previously, manually choose the maximum value for both curves.
Why does a motor seem to turn a little bit more than the other one? Motors should turn equally and even if the difference is very small it can happen that a motor turns more than the other one due to the robot geometry, or if the light or color sensor is not well located in the middle of the robot, or if the robot weight is not evenly distributed, or if the wheels are not well built and arranged at the same distance from the robot axis, or if one wheel slips more than the other one on the field surface (the one that moves as well as the one that should be stopped, in fact we have seen that a supposedly stopped wheel can actually turn backwards…), or if the field surface is not clean enough or if it has an unnoticeable lean towards one side. If the differences are big, you can revise the robot construction and repeat again the experiment, and probably you will obtain a slightly different result with very similar rotations between both motors. This is a very important point to take into account, especially when going to a competition or when big precision of movements is required.
Finally, this graph image also shows a very interesting interface tool that allows querying the sensors values in a specific point, in our case the position around the 4.5 second where motor “B” rotations are the biggest and which corresponds to a line intersection on the line the robot follows. This tool can be accessed from the menu “Analysis Tools” in NXT or from the icon menu “Analysis” with the option “Point Analysis”. The line corresponding to the analyzed point in a specific time can be dragged to the desired point, in our case near the second 4.5. We can also name it, generate as many analysis points as we want, and save all these analysis points with the experiment for future use.
The experiments interface also offers other tools like an area analysis tool, a magnifying glass, to zoom into the image on a specific area, and a prediction tool, all of them very easy to use and that can be very helpful.
Incremental exercise 6: Get to the end of the cage!
As we have seen previously, when following the line, the robot makes small movements to the right and to the left, but when it encounters an intersection, then, to continue following the branch of the line to follow, one wheel does more rotations than those needed to follow the straight line, while the other wheel remains stopped. To control the global robot movement, we can detect when this rotations increment of the adequate wheel is produced, stop the line following, turn the robot to the appropriate side (the one towards this intersection) and continue following the line.
To do the incremental exercise, we only need to monitor one wheel. In our case, we only need to control motor “B” rotations on the right, since the robot follows the black line on the left, that is, in the interior side of the filed, and when finding the intersection line, that goes to the left, wheel “C” stops and wheel “B” does more rotations than when it follows the straight line, to find the “white” color.
As we have seen, to control a motor’s degrees or number of rotations, the internal rotation sensor block provides a way to compare the rotations with a specific threshold, 60 degrees in our case. If the rotations are bigger to the activation or threshold value, then the attribute or plug out “Yes/No” of the data hub will return the value “True”, which we can connect to the loop logical plug in, using a data wire, to stop the line follower by getting out of the loop.
Tip: Remember that to connect a block logical attribute, which is inside a switch, to the logical connector of a loop that contains the switch, the switch “Flat View” needs to be unselected to be able to “cross” it. In EV3 alternatively you can use a “Loop Interrupt” block to force the exit of an unlimited or forever loop.
Port B rotation sensor control panel (NXT)
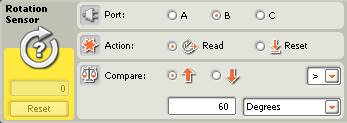
As we have seen, observe that the rotation sensor needs to be reset after reading the supervised wheel rotations, for each line following cycle. To count the rotations, the rotation sensor needs to be placed just after stopping the supervised motor and before starting the opposite motor rotations.
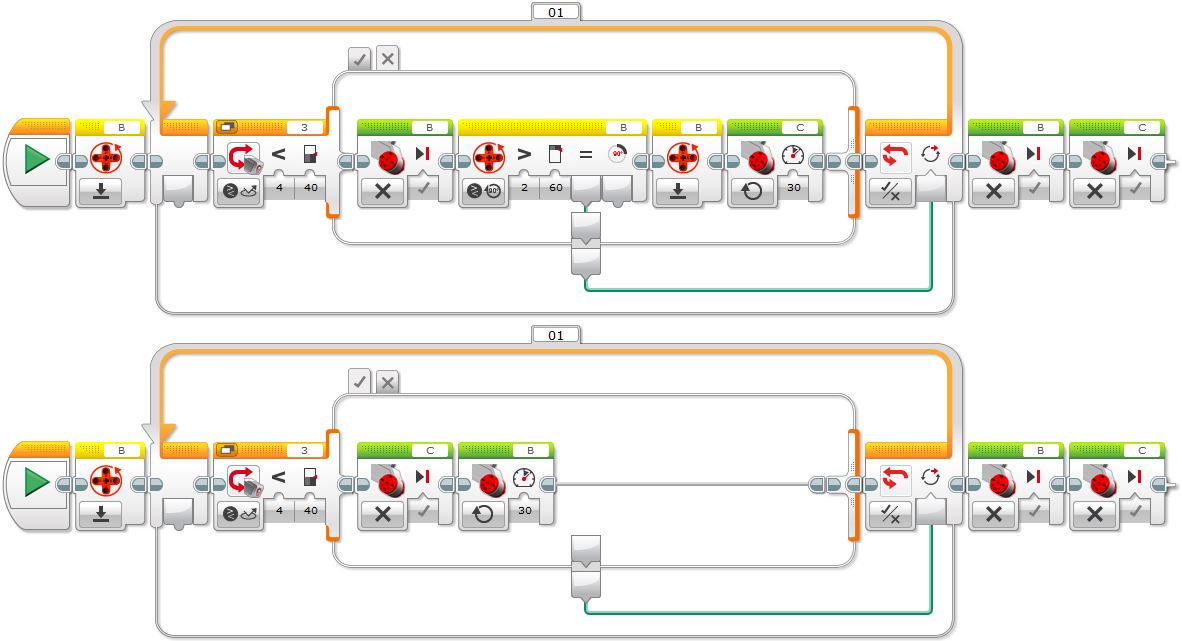
Line follower that stops when detecting a rotations threshold bigger than 60
degrees in the internal rotation sensor associated to motor “B” (NXT)
Line follower that stops when detecting a rotations threshold bigger than 60
degrees in the internal rotation sensor associated to motor “B” (EV3)
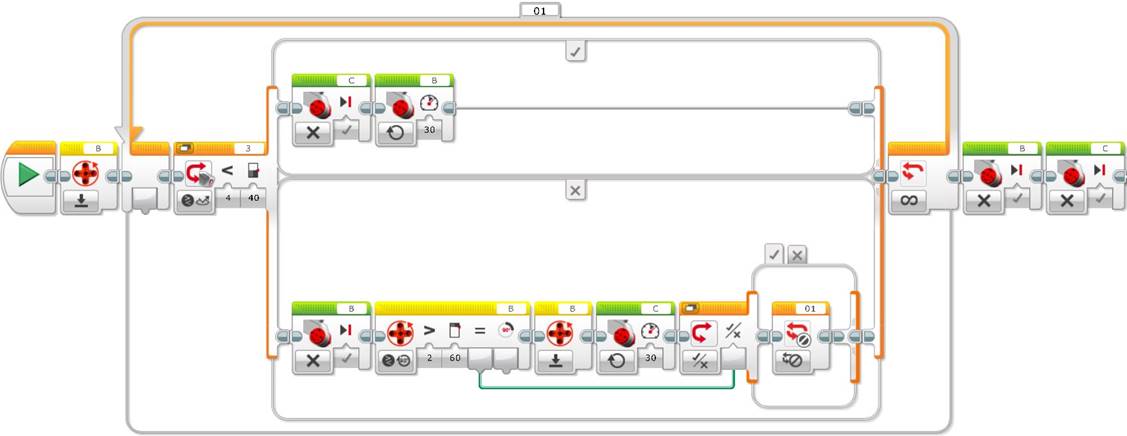
Line follower alternative that stops when detecting a rotations threshold bigger than 60
degrees in the internal rotation sensor associated to motor “B”, using a loop
interruption (EV3)
At a global level, to do the incremental exercise we need a line follower every time there is a direction change or a line intersection. To get over the points of direction change we only need either to execute some rotations in the appropriate wheel to turn the robot and start a new line following path (making a point turn with a stopped wheel), or to go forward to surpass the intersection line (in this case since the robot will have turned, we only need to make it turn to the opposite side to recover the robot direction, surpassing the intersection). Observe as well, that in function of the robot’s turning direction, sometimes we need to monitor the right wheel and sometimes the left one, as shown below. For this last point, we can ask the students what needs to be changed in the program to make the robot follow the line from the other side.
Incremental exercise programing using a simple line follower
with rotations control to detect each intersection line (NXT)
Incremental exercise programing using a simple line follower
with rotations control to detect each intersection line (EV3)
What are the advantages of using a rotation sensor instead of a light or color sensor that we have used in the previous pedagogical unit, to do the incremental exercise? If using the light or color sensor the code is less compact, the big advantage of this solution is that it can even work if we modify the size of the field or the robot starting point. Thus, this solution is more generic and more robust than the one of the previous pedagogical unit.
What disadvantage can we observe in the previous program? What we can see is that the program duplicates the line follower code after each intersection. Further on we will see how we can encapsulate this code in a user block or subprogram to make it much more compact and efficient.
Acquired knowledge: Datalogging using a file or through the program interface with the corresponding blocks to start or stop recording, not only allows to record data dynamically, while the program executes, but also allows to observe in detail, study and understand how a program works, and it is a very good program debugging system. In addition, students learn how to interpret numeric data, how to interpret and relate graph curves, how to use logic switches, how to pass information between program blocks using data wires, how to access and manage the intelligent brick memory, and how to put into practice all the knowledge acquired in the previous pedagogical units.
![]()
![]()
![]()
![]()